


Overview:
(For the Week Ending Wednesday, June 4, 2014)
- Natural gas spot prices decreased slightly yesterday, but ended slightly higher for the report week (Wednesday, May 28, to Wednesday, June 4). The Henry Hub spot price averaged $4.57/MMBtu yesterday, an increase of 3 cents/MMBtu over last Wednesday’s $4.54/MMBtu average.
- At the New York Mercantile Exchange, the July 2014 contract moved into the near-month position last Thursday. It increased by 13.5 cents/MMBtu for the report week, from $4.615/MMBtu last Wednesday to $4.640/MMBtu yesterday.
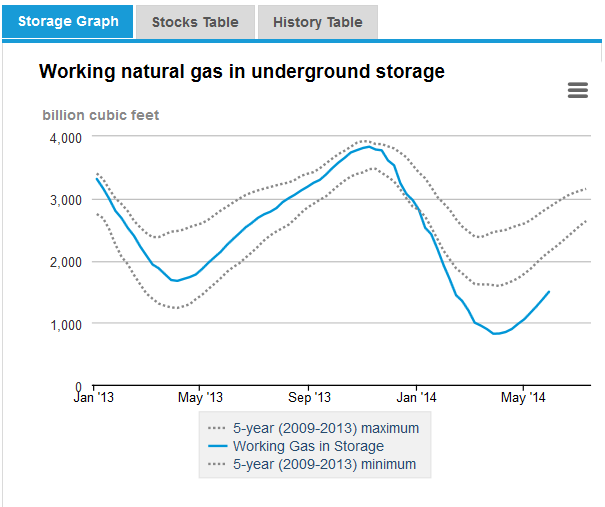
- Working natural gas in storage rose to 1,499 Bcf as of Friday, May 30, according to the U.S. Energy Information Administration (EIA) Weekly Natural Gas Storage Report (WNGSR). A net increase in storage of 119 billion cubic feet (Bcf) for the week resulted in storage levels 33.0% below year-ago levels and 37.4% below the 5-year average.
- The Baker Hughes active rig count totaled 1,866 as of May 30, up 9 rigs from the previous week. The number of active natural gas-directed rigs increased by 1, to 326. The number of active oil-directed rigs increased by 8, to 1,536. A decline of 5 oil-directed rigs in the Williston Basin in North Dakota and Montana, which includes the Bakken Shale play, partially offset a 13-rig increase in the rest of the United States, including an increase of 4 oil-directed rigs in the Permian Basin in Texas and New Mexico. The oil-directed rig count is currently 126 greater than this week last year, and the natural gas-directed rig count is 28 less than this week last year.
Storage
Weekly net storage increase is the fifth largest in EIA records. The net injection reported for the week ending May 30 was 119 Bcf, 26 Bcf larger than the 5-year average net injection of 93 Bcf and 11 Bcf larger than last year’s net injection of 108 Bcf. Working gas inventories totaled 1,499 Bcf, 737 Bcf (33.0%) less than last year at this time, 896 Bcf (37.4%) below the 5-year (2009-13) average, and 642 Bcf (30.0%) below the 5-year observed minimum.
Storage build is larger than market expectations. Market expectations called for a build of 116 Bcf. When the EIA storage report was released at 10:30 a.m., the price for the July natural gas futures contract fell 7 cents to $4.59 /MMBtu on the Nymex. Prices rose 5 cents in the hour following the release.
From the week ending on April 4 to the week ending on May 30, net storage injections have totaled 677 Bcf, versus 536 Bcf for the same seven weeks in 2013, and 581 Bcf for these weeks between 2009 and 2013, on average. The average unit value of what storage holders put into storage from April 4 to May 30 was $4.60/MMBtu, 12% higher than the average value for the same seven weeks last year of $4.10/MMBtu. The highest winter-month Nymex price (for next January) in trading for the week ending on May 30 averaged $4.62/MMBtu. This was 13 cents more than the current Nymex July contract price. A year ago, the difference was 28 cents/MMBtu.
There are currently 22 more weeks in the injection season, which traditionally occurs April 1 through October 31, although in many years injections continue into November. EIA forecasts that the end-of-October working natural gas inventory level will be 3,405 Bcf, which, as of May 30, would require an average injection of 87 Bcf per week through the end of October. EIA’s forecast for the end-of-October inventory levels are below the 5-year (2009-13) average value of 3,837 Bcf. To reach the 5-year average, average weekly injections through the end of October would need to be 106 Bcf.
Three regions post larger-than-average builds. The East, West, and Producing regions had net injections of 69 Bcf (15 Bcf larger than its 5-year average injection), 19 Bcf (4 Bcf larger than its 5-year average injection), and 31 Bcf (7 Bcf larger than its 5-year average injection), respectively. Storage levels for all three regions remain below their year-ago and 5-year average levels.
Temperatures during the storage report week were warmer than normal. Temperatures in the Lower 48 states averaged 68.4 degrees for the week, 3.0 degrees warmer than the 30-year normal temperature and 4.9 degrees warmer than during the same period last year.